

Last updated on 23/06/2021
Today I will tell how to get a picture of the Earth from NOAA satellites within the city with a minimum set of equipment – an SDR receiver from RTL-SDR Blog and a conventional dipole antenna.
Professional radio equipment for receiving or transmitting radio signals, like any other non-mass equipment – not cheap equipment. But there is a very popular, and most importantly cheap device for receiving signals – DVB-T receiver with chip RTL2832U. Its main purpose to receive first-generation digital television broadcast on computers and portable media. Although DVB-T (not to be confused with DVB-T2) has not become widespread, the RTL2832U chip has become a real discovery for radio amateurs.
Briefly about RTL2832U and RTL-SDR
Originally, no one guessed about other possibilities of this receiver other than digital television. Workflow of this device quite simple – built-in chip digitizes high-frequency signal, then computer and software extract desired frequency and information from it. This key fact that computer, not the chip, processes the signal, became a basis for creation of Software Defined Radio (abbreviated SDR) based on this platform and ushered in the era of RTL-SDR. For $10 (cost of a ready-made(!) DVB-T receiver) user gets a receiver with a bandwidth of 3 MHz and no restrictions on tuning accuracy or modulation type. Also frequency range of 22 – 948.6 MHz in the worst case (super-cheap tuner FC0012) or 24 – 1766 MHz in better case (slightly more expensive and rarer tuner R820T/2)! Opportunity to acquaint oneself with the world of radio communication for such price is very incredible.
Variations
I have two receivers of this kind. First one is based on cheap FC0012 chip. This exact model can be quite easily bought on Ali Express. But this receiver has a narrower frequency range, more noise, also it badly holds set frequency and overheats quickly, which worsens the already not perfect performance. Even if you just want to try SDR, this receiver is still a bad option. Maybe you can give it a try if find that receiver for free somewhere.
My second receiver is device from radio amateurs from RTL-SDR Blog. According to them, the board is designed better, has more stable workflow, less noise, heat dissipation, and good chip R820T/2. This ensures better signal reception and more information that can be obtained from it. Indeed, in my experience, the performance of this receiver is much better compared to its cheaper “relative”.
Additional accessories
For better performance, I recommend buying a Low-Noise Amplifier (LNA). This amplifier will significantly improve reception quality, which will give ability to reduce the level of internal amplification, and with it the noise level.
Also, if you live in a city with powerful transmission stations or repeaters, an FM radio frequencies filter will very helpful. With such a filter, the receiver will be not “overloaded” by powerful signals and will better recognize signals at nearby frequencies, in particular the APT signal frequencies of NOAA satellites – 137 MHz.
Signal recording requirements
Now practice! I will record signal from the NOAA weather satellites using an RTL-SDR receiver, LNA, FM radio frequencies filter, and basic dipole antenna from the RTL-SDR dipole antenna kit.
First, a kind of successful attempt to record this signal I got straight from my apartment. Signal was pretty good, but an image in result contained a huge amount of noise.
Radio amateurs from all over the world, who record the same signal just because of curiosity (like me), or using their own “weather” stations, use special QFH antennas, which are placed in open areas or on the roofs of their homes. But I interested is it possible to successfully obtain images within the big city, somewhere in an open location.
1. Location
That’s why I first decided on a location in my city Lviv. Only two areas that would have a good view of the horizon came to mind – the High Castle and the bridge over Luganska Street. First location is generally greatest in all respects, except for the fact that it also houses the Lviv TV broadcast tower, which means that the SDR receiver can simply be overloaded with a strong signal from the broadcasting signals.
So, recording location will be a bridge over Luhanska Street.
2. Time and satellites
Next step is to determine time when the weather satellites will fly over the desired location. To do that, I’m using an application called WXtrack.
Firstly necessary parameters needed to be set, in particular the minimum angle of the satellite above the horizon, and then a list of predictions will be generated. The best option was 8 PM o’clock in the evening on June 6, 2021, GMT+3 – that time in timeslot of 30 minutes as many as two satellites will fly high enough above the horizon – NOAA 15 and NOAA 19.
Location – got, time – got, satellites are known, so we ready to prepare and go to the exact place.
We arrived at location, I connected the antenna to tripod and the receiver to laptop. At some time when the satellite rise above the horizon and the signal appear in the SDR application, you can start recording. Of course, when the signal level is weak, the picture will be not good, but you can cut everything unnecessary on stage of decoding.
Recording here is an audio signal, demodulated using frequency modulation with a bandwidth of 34 kHz. I recorded 50 kHz bandwidth, because of the fact that when the satellite moves above the round Earth, the frequency will “slip” slightly due to the Doppler effect.
In a few minutes of reception, when the satellite rose high enough above the horizon, the signal level increased so much that I reduced the internal gain of the receiver to 25 dBm, ie half possible. With this configuration, I received the same signal level, but the noise level was significantly reduced. LNA helped quite much here.
In 10 minutes, the satellite reached the highest altitude, so even obstacles from passing trains and trams did not distort the picture. The only problem was unknown “moving” signal, which caused some distortions that will be visible on the resulting image in the form of black stripes.
Decoding
After recording, I quickly tested received signal with application NOAA APT Decoder. Result was amazing – clear picture, all telemetry data, and amount of well-received information – huge. With such great results, you can happily go home and decode all data with the more powerful application WXtoImg.
But firstly, recorded signal must be transcoded into the format suitable for WXtoImg. Easiest way to do that is to use the same NOAA APT Decoder. Open recorded audio file, make sure that file is correct with decoding. Then open Resample WAV from menu, select same source file, select location to save transcoded file and press Resample. Same process must be applied for all the recordings.
Now we can start working in WXtoImg.
WXtoImg is distributed as freeware with a limited set of functionality that can be “unlocked” by purchasing a license. But even that minimal set of features is more than enough.
So, first step is to update the information about the satellites, it’s important for the correct calculations. Then open a source audio file with signal and wait for the decoding process to complete. Result will be same as in NOAA APT Decoder – shown map overlay, shown telemetry, and noises at edges here as well.
Therefore, we will hide telemetry and cut off noise.
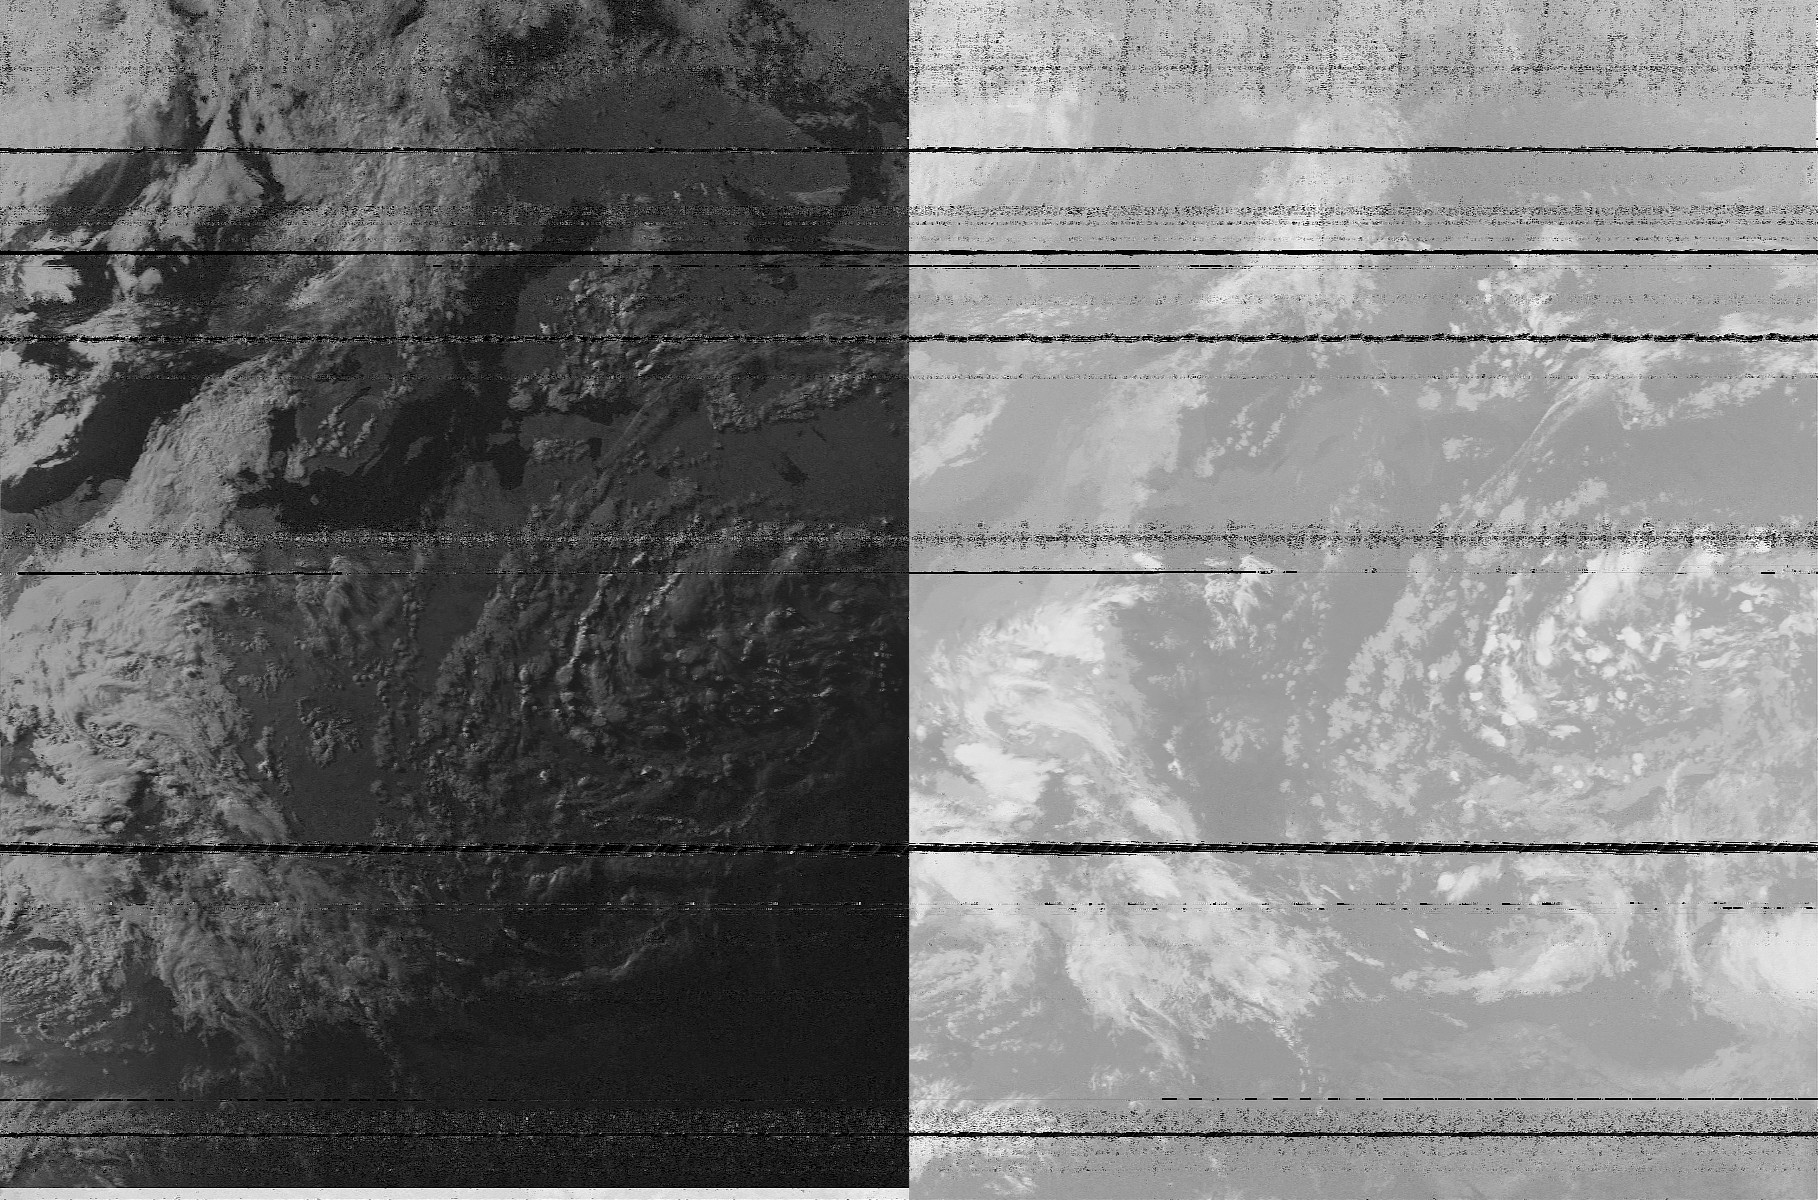
NOAA satellites record images in two infrared wavelengths, so the resulting images are not classic images of visible light spectrum from regular cameras. However, using such images (plus telemetry data), you can get both a color image and temperature maps or other useful meteorological information.
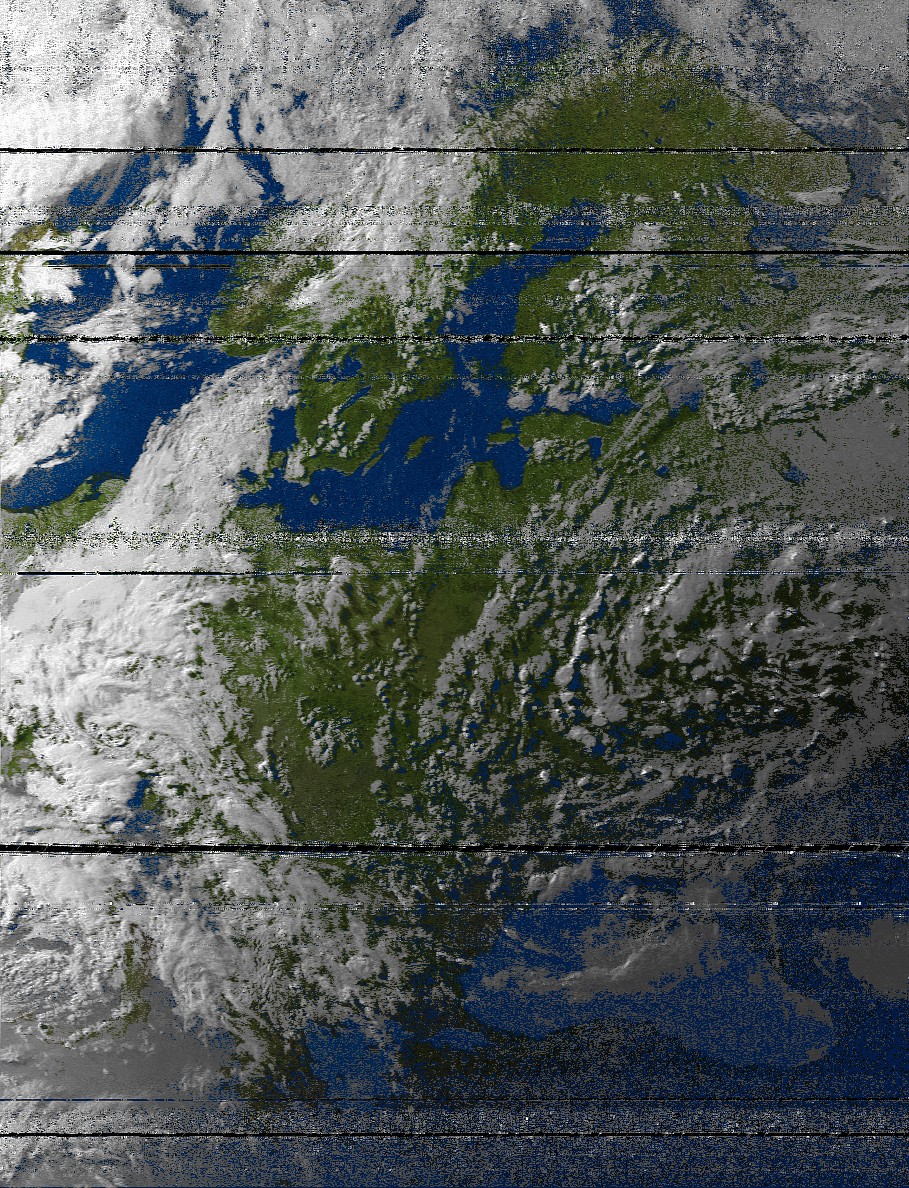
NOAA 15
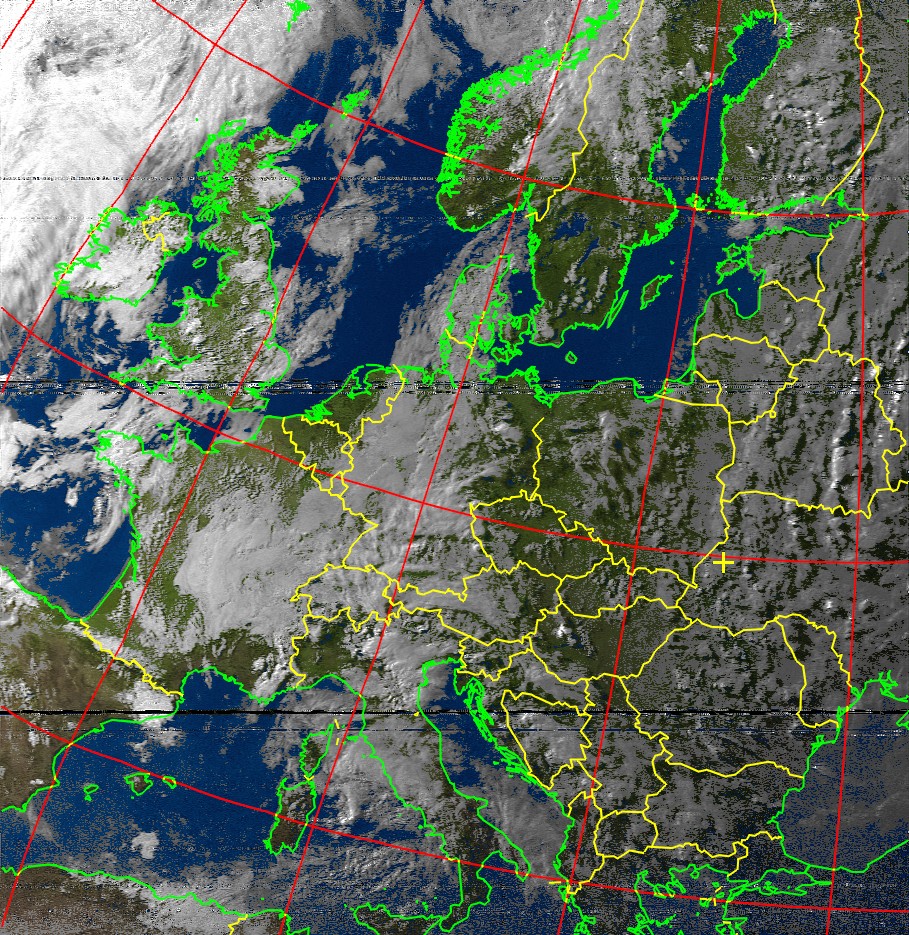
You can get a color image by opening the Enhancements menu and selecting MSA multispectral analysis. The result is impressive. Reservoirs, seas, uneven landscapes and clouds are perfectly visible.
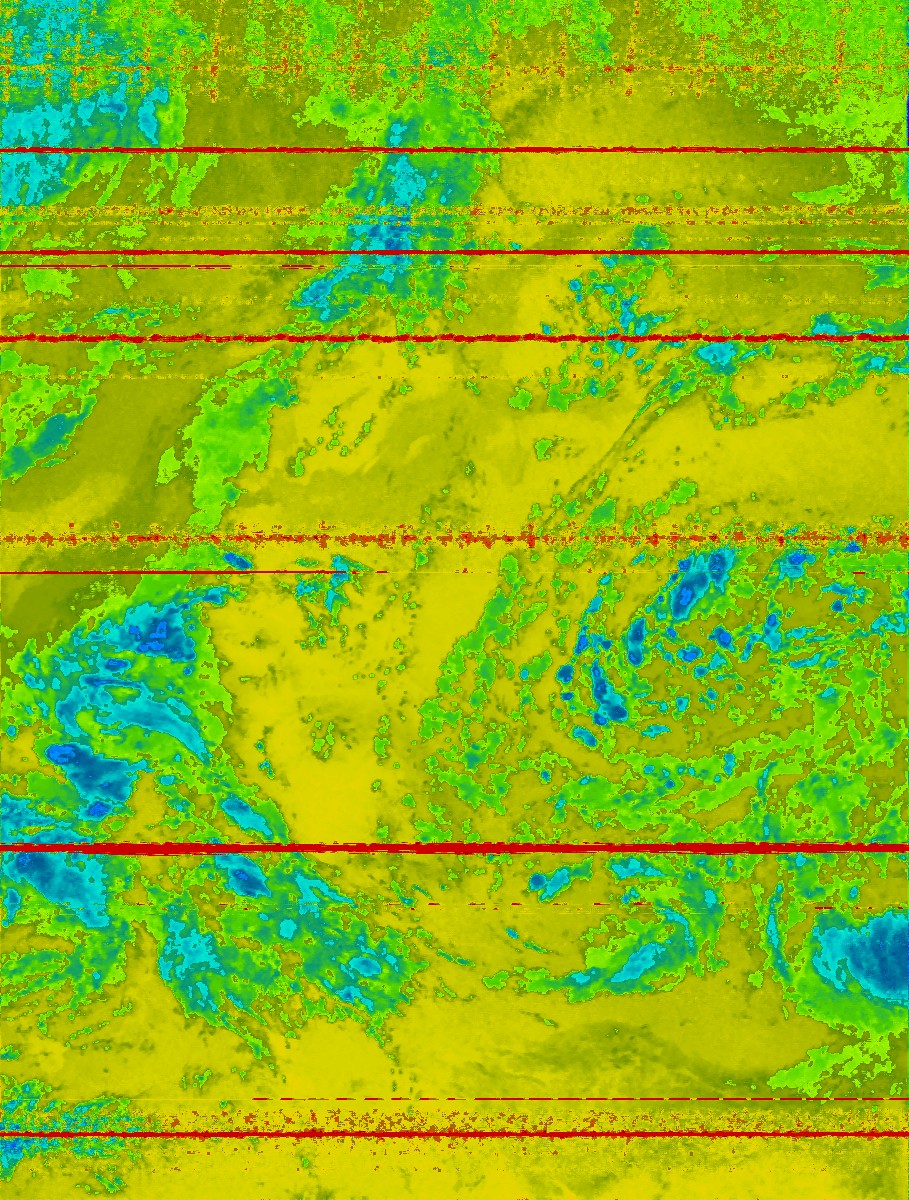
And by choosing Sea surface temp enhancement, we get an amazing map of water temperatures. Even the [biggest Ukrainian river] Dnipro is visible, not just seas.
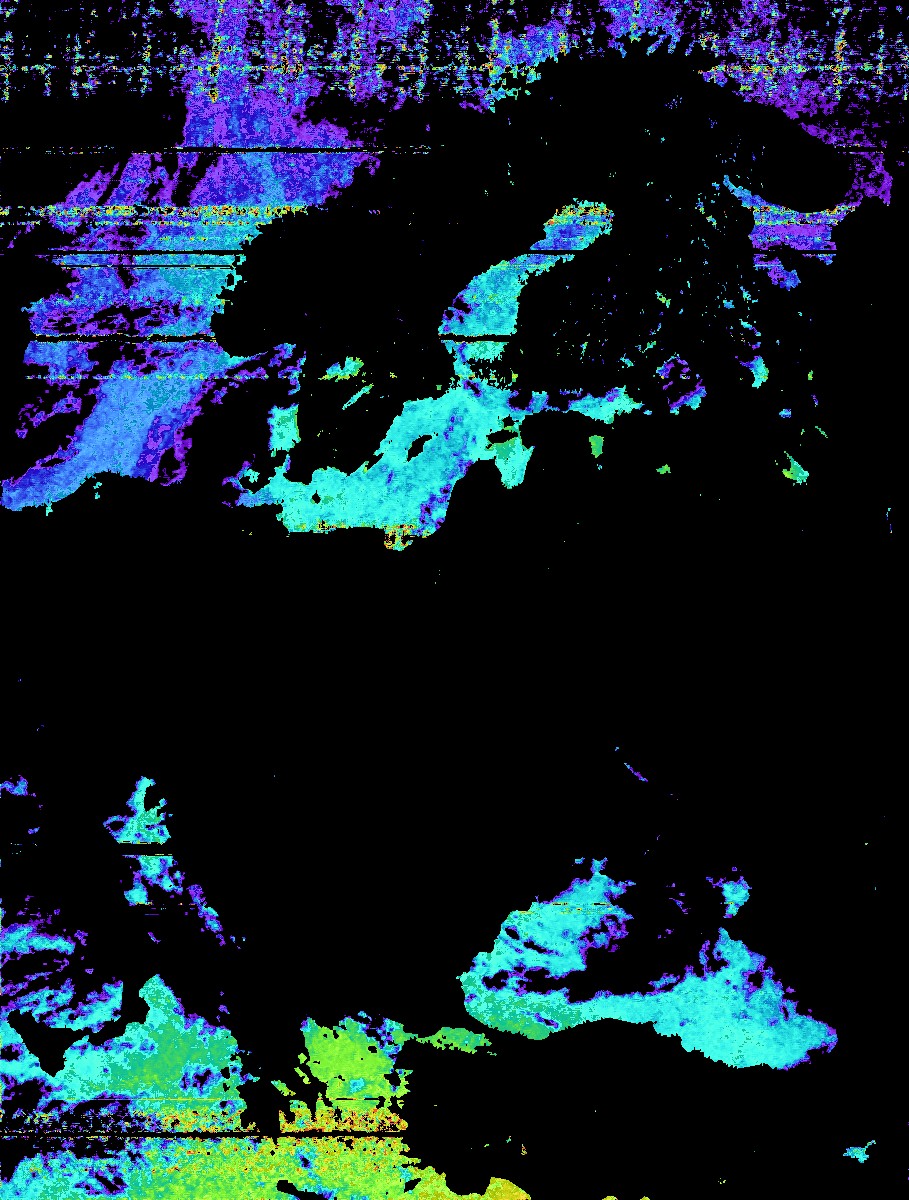
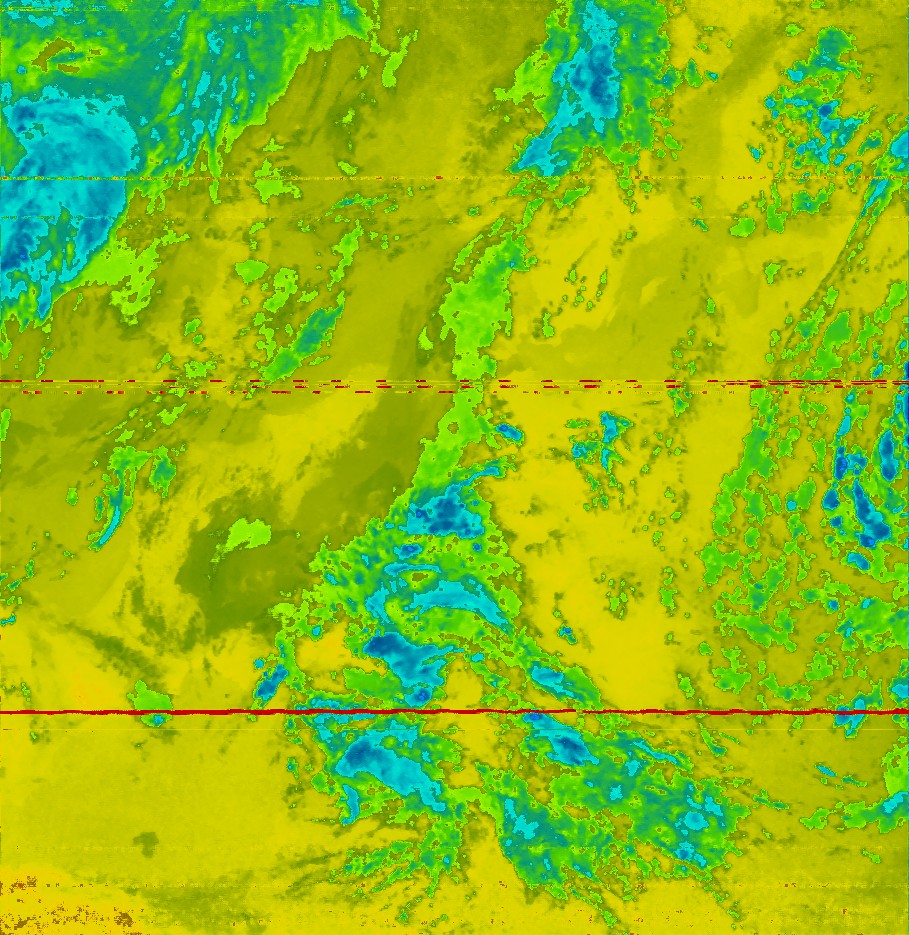
And the last interesting enhancement is the thermal map.
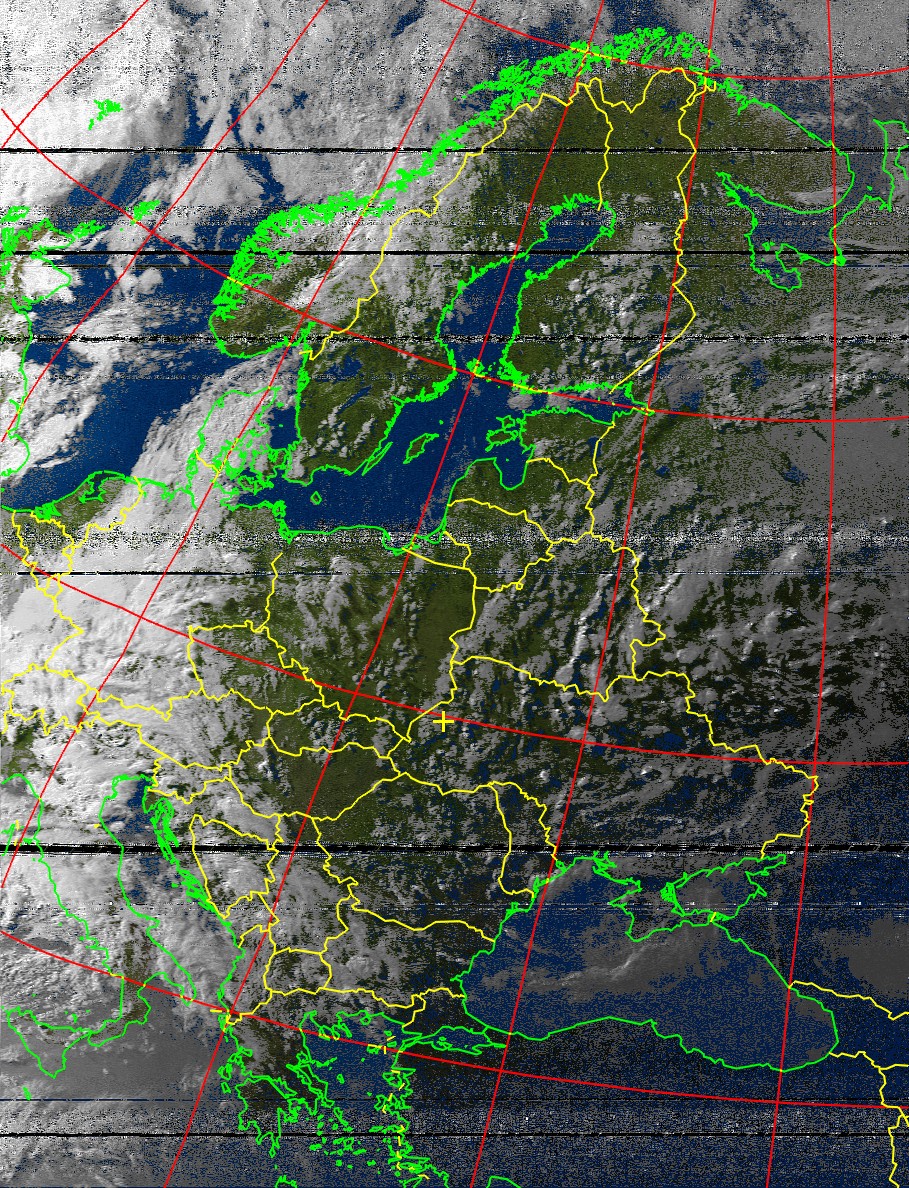
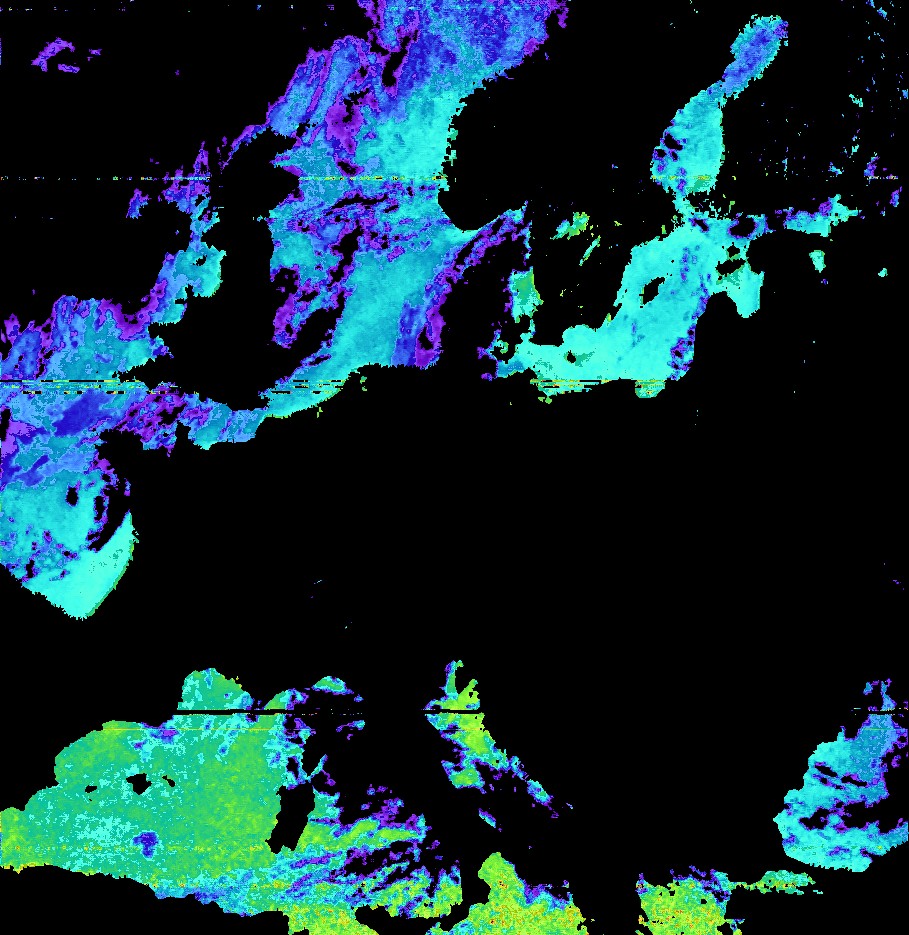
NOAA 19
Similarly, we can decode images from the signal of another satellite.

Thus, with RTL-SDR receiver and simple dipole antenna, even within a large city, you can get perfect signal from weather satellites.